Maxim Kobzev,
Data Visualizer and Dashboard Creator
Data normalizer, data modeler and data visualizer. Dashboard and report creator. Helping companies make informed business decisions based on compelling visuals.

Featured projects
A selection of Tableau apps

Airports of the World
Worldwide overview of the existing airports, runways and airline routes
Metro systems of the World
An overview of the World's metro/subway/rapid transit systems
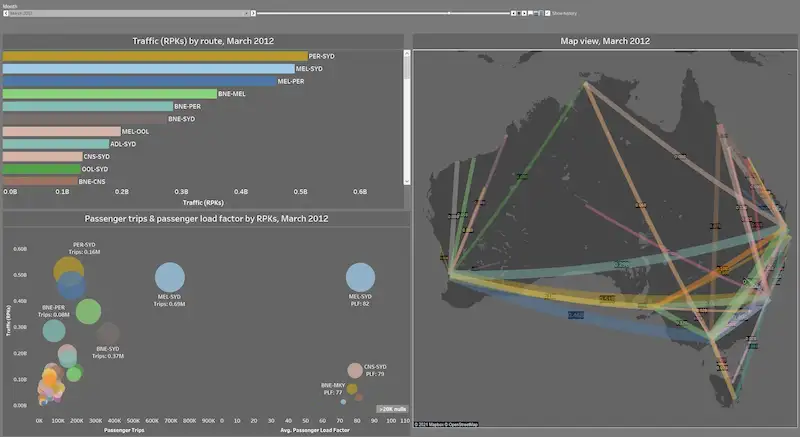
Australian airline routes
Evolution of the Australian domestic airline routes

Influence of COVID-19 restrictions on passenger traffic
Passenger traffic by airport
A selection of Power BI dashboards and modeling cases
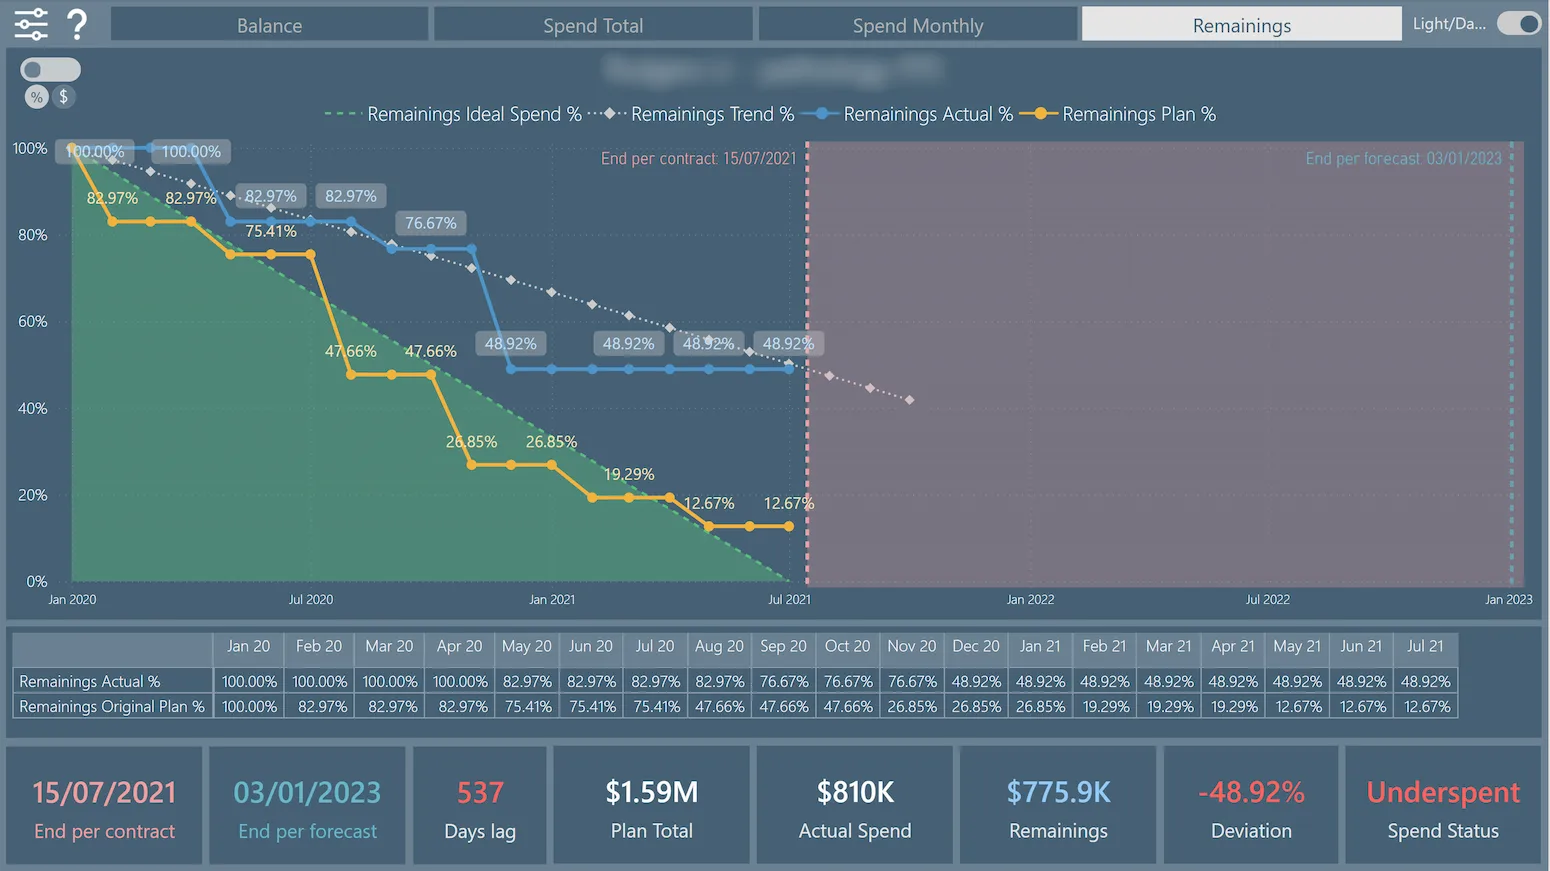
Budget use progression chart
Overview of the remaining budget for a healthcare IT contract
Contracts overview dashboard
Overview of the IT healthcare contracts running for the current year
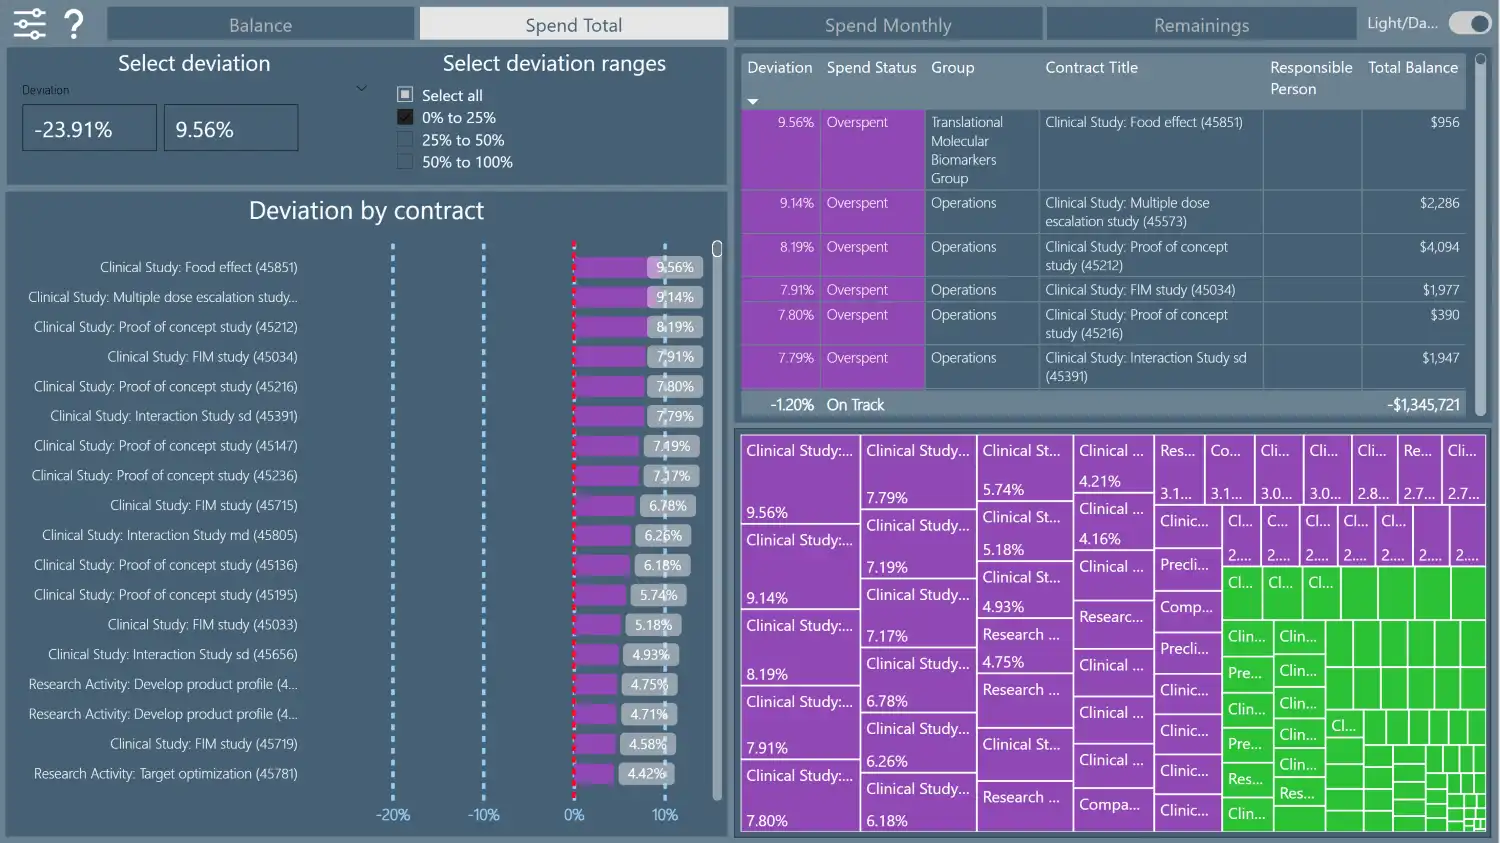
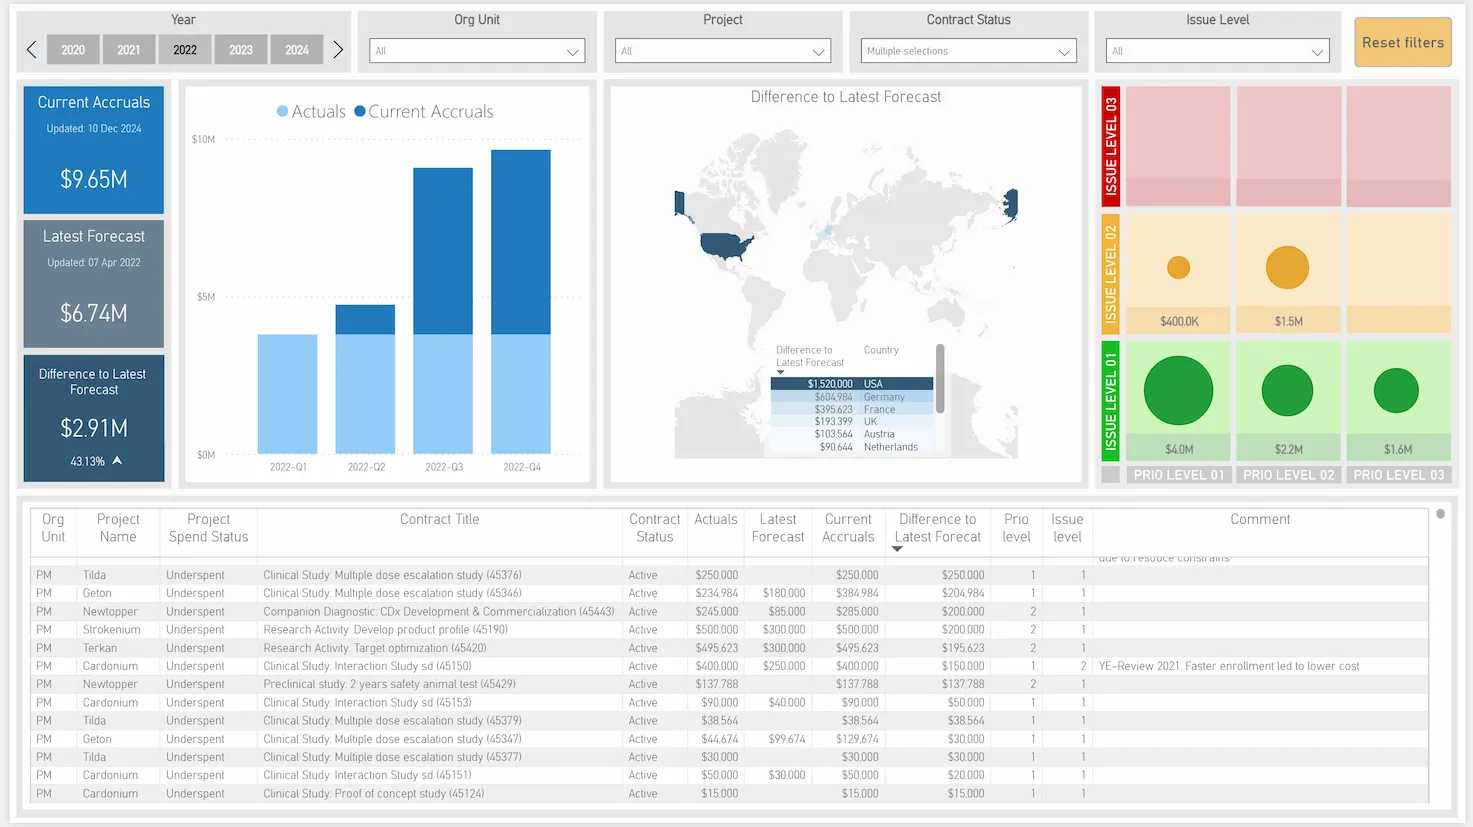
Deviation & tree map chart
Overview of the total spend including the details by a contract
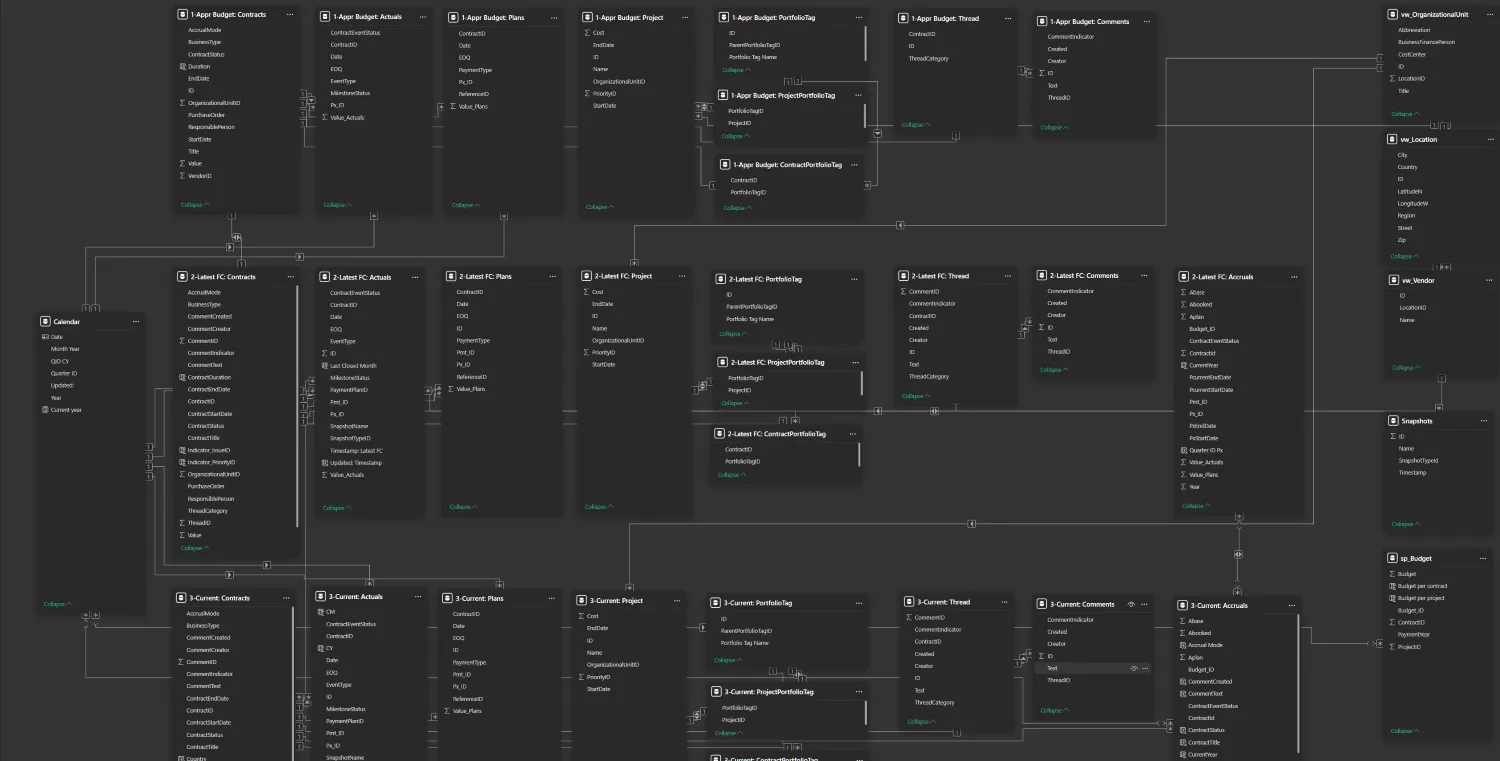
Data modeling example
A complex data modeling example in Power BI
An example of Power Apps soluiton
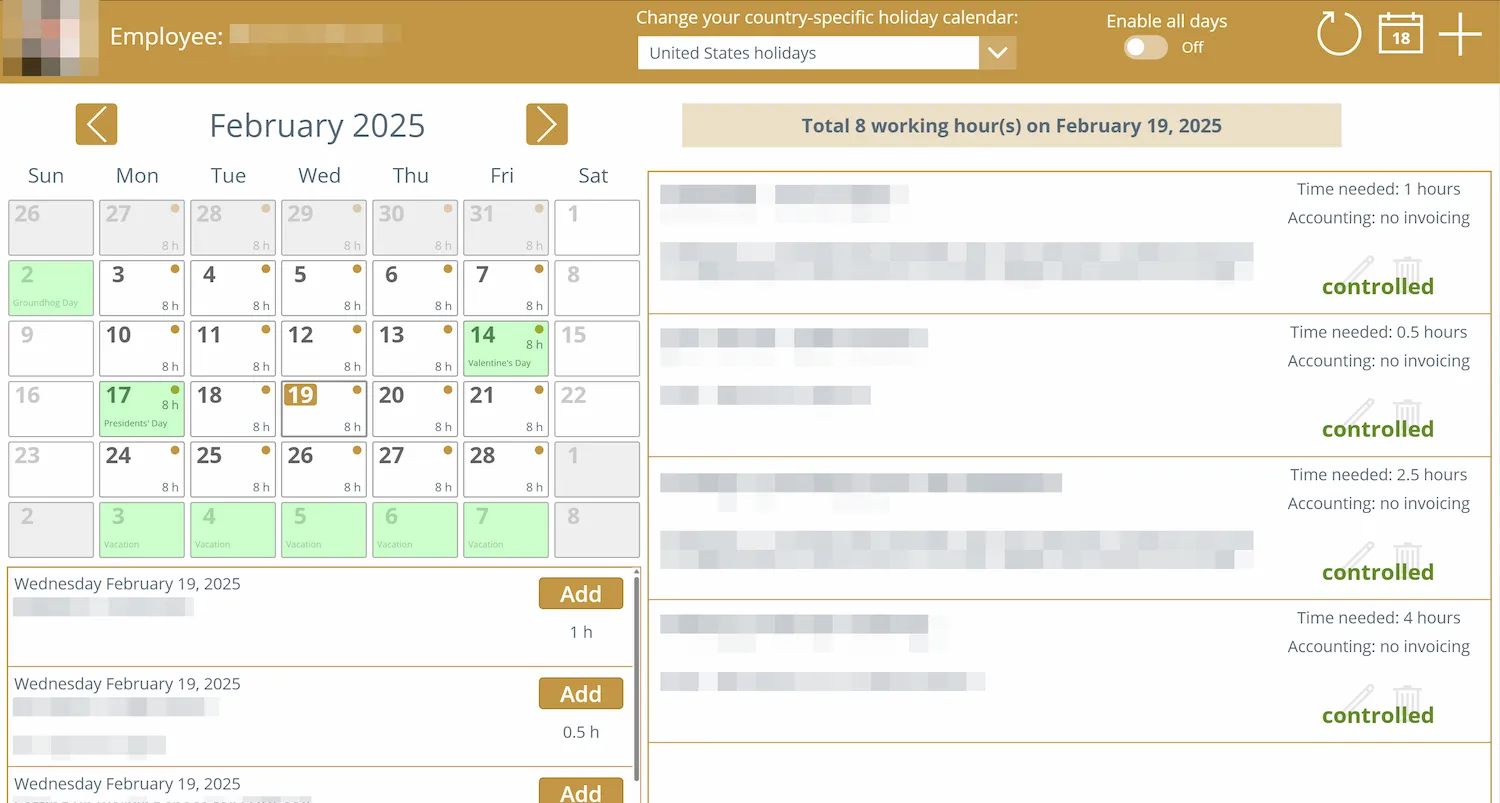
Billable hours calendar app
Overview of a selected day with submitted billable hours
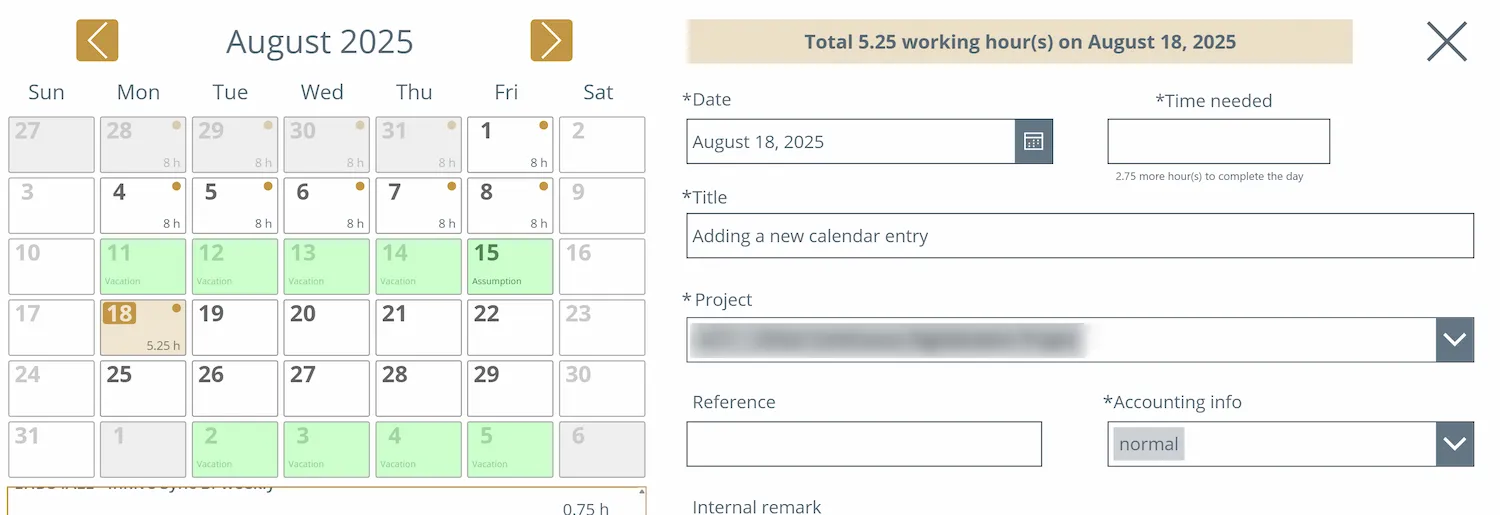
Billable hours calendar app
Adding a new calendar entry for a selected day
A selection of R Shiny apps
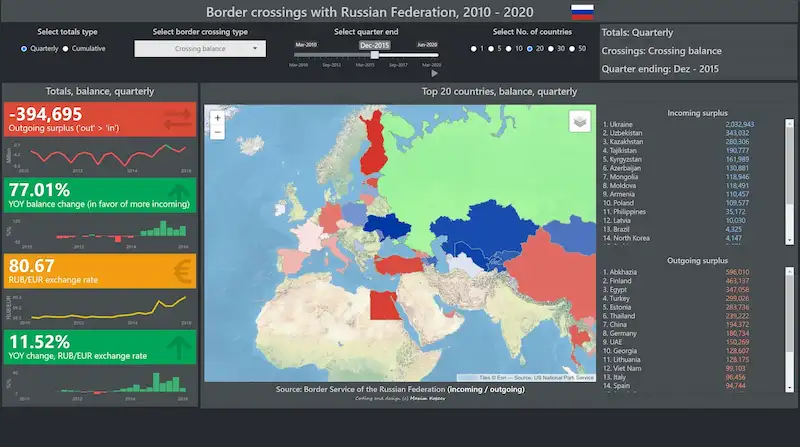
Border crossings with Russian Federation
Detailed overview of border crossings with Russian Federation, split by countries
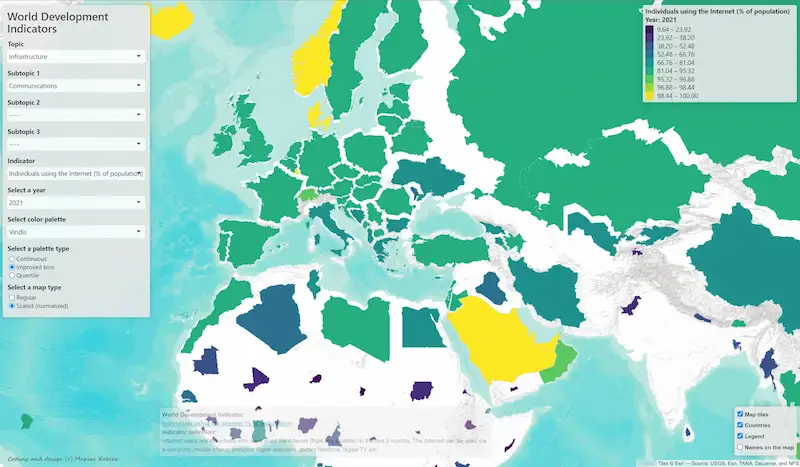
World Development Indicators on a map
Comprehensive overview of the World Development Indicators on an R Shiny map
A selection of Looker Studio apps
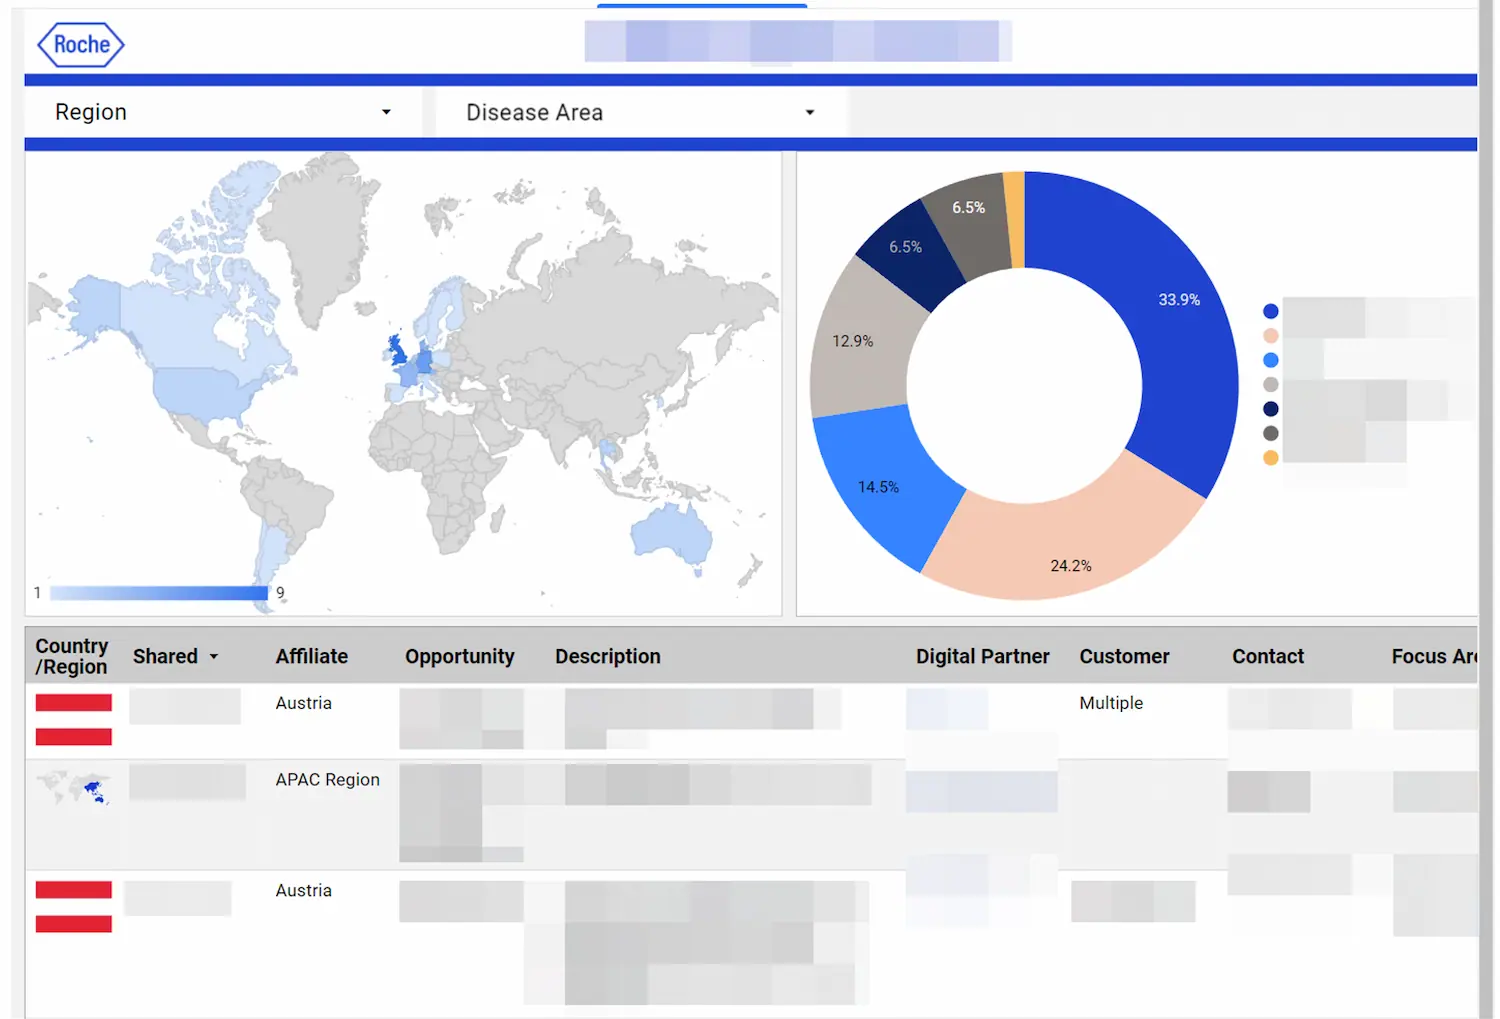
A global pharmaceutical project dashboard
A split of a global pharma project by a disease area
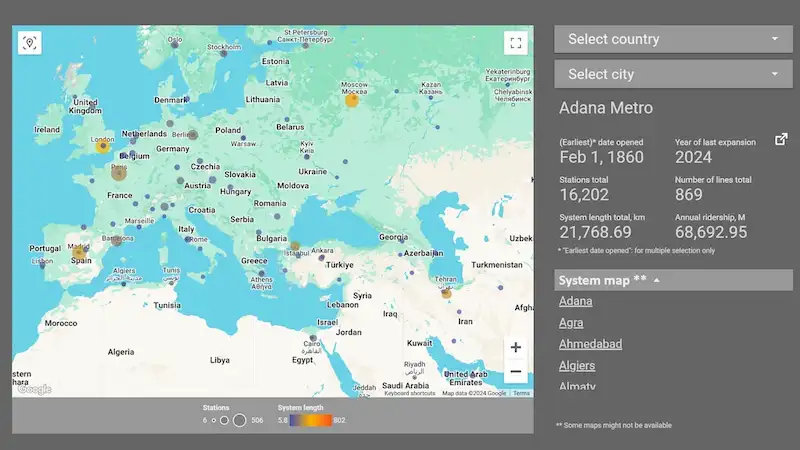
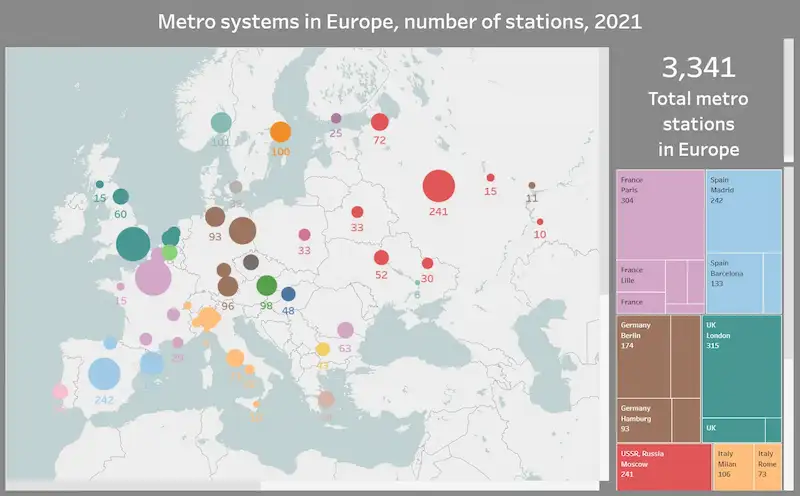
Metro systems of the World
An overview of the World's metro/subway/rapid transit systems
An example of a Datawrapper app

Metro systems of the World
An overview of the World's metro/subway/rapid transit systems
A selection of Excel dashboards
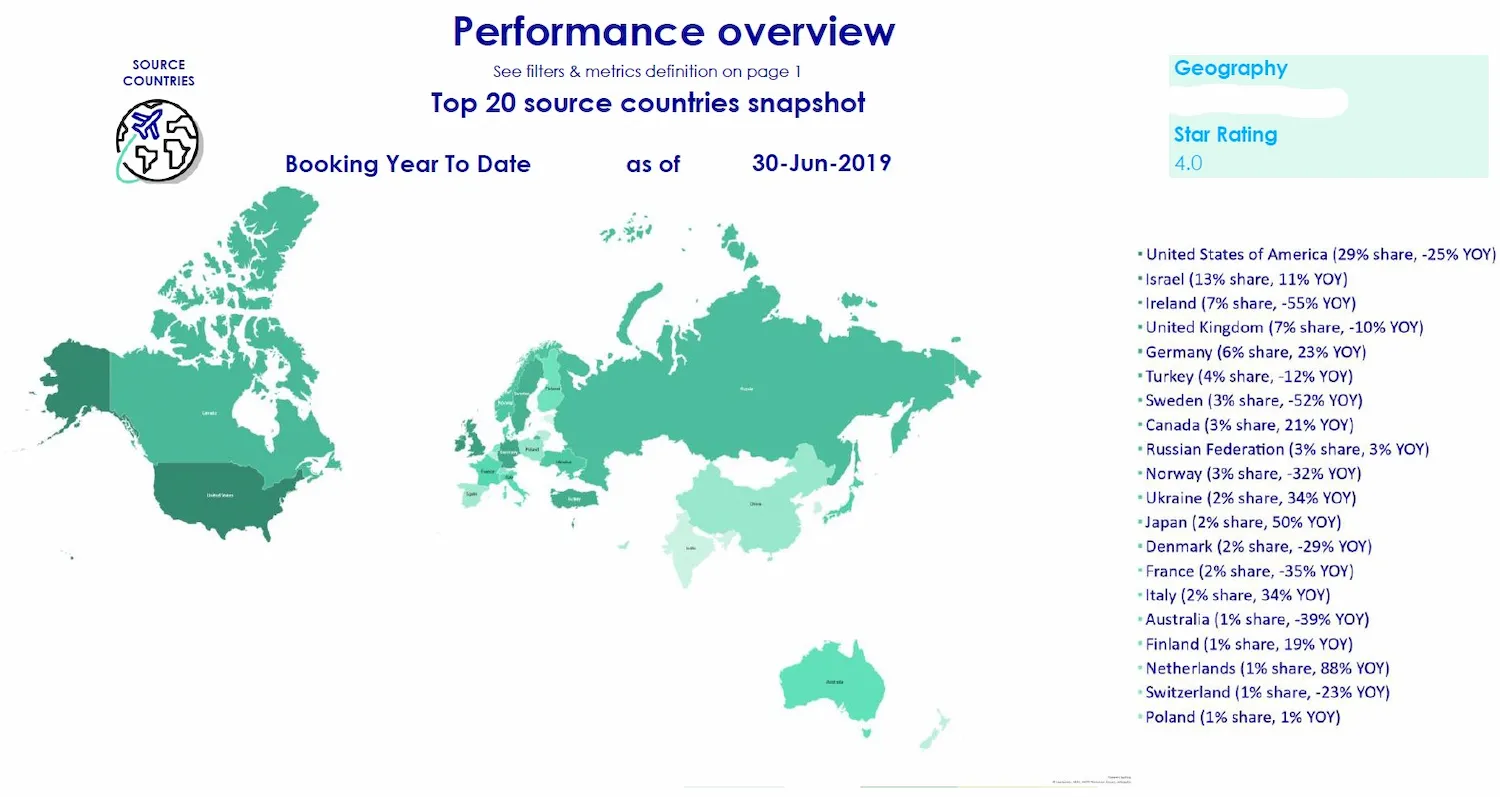
Performance dashboard of a hotel chain
Detailed overview of a hotel chain performance
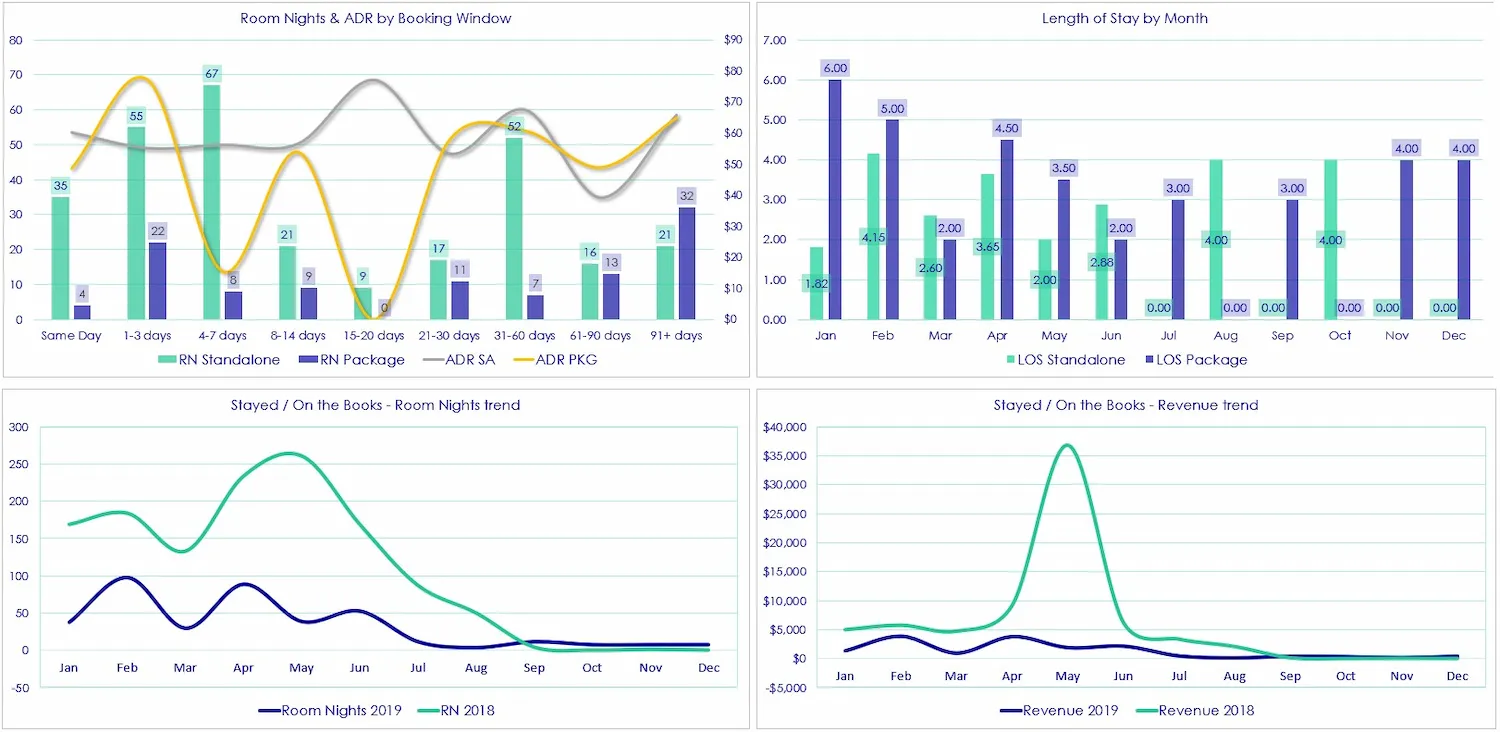
Performance dashboard of a hotel
A hotel bookings performance overview split by country
Work Experience
Senior Business Analyst

November 2025 - current
- Optimizing SQL queries in MariaDB and Power BI
- Data Modeling in Power BI
- Development of KPI dashboards with Power BI
Senior Data and Visualization Engineer / Senior Data Manager and Project Coordinator
![]()
2021 - October 2025
- Development of dashboards and visualizations using Power BI, Tableau, Looker Studio and Datawrapper
- Development of canvas and model-driven Power Apps using Power Automate, Microsoft Graph and Dataverse
- Data normalizing and modeling in Power BI, Tableau, Tableau Prep and Google Sheets
- Code optimization with SQL (stored procedures), DAX, Power FX and Power Query
- Agile software development with Jira, Confluence, Trello and Miro
Contractor &
IT advisor
![]()
Roche Information Solutions
2021 - 2025
- Development of dashboards & visualizations in Tableau and Looker Studio
- Collection, validation of data, visualization and content management for navify® Integrator evidence generation case study
- IT advisory on pre-due diligence / pre-request for proposal / initiative sunsetting
- IT advisory on FAIR data principles, data reusability, data governance and data privacy
IT advisor &
Software developer
![]()
2023 - 2024
- Development of Power Apps solution for sample tracking management
- Integration of Power Apps and Salesforce solutions
Data Visualizer &
Dashboard Creator
2019 - 2021
- 7 published Tableau apps
- 5 published R Shiny Dashboard apps
- 3 published Power BI projects
Report Developer &
Market Manager
2008 - 2019
- 100 reports & visualizations created in Excel, Tableau and Power Point
- 300 colleagues across the orgs helped with increasing the productivity and achieving the KPIs
- 50 coaching sessions on reporting provided for colleagues in EMEA, APAC and Americas
- 20 Expedia market summits prepared and conducted in Russia, Ukraine, Romania and Bulgaria
- 20 webinars for hotel partners provided in 7 countries across Eastern Europe
Core competencies
- Normalizing data in MDX, DAX, R, Tableau Prep and Google Sheets
- Modeling data in Power BI, Tableau and Google Sheets
- Creating dashboards in Excel, R Shiny, Tableau, Power BI, Google Sheets, Looker Studio and Datawrapper
- Creating canvas and model-driven Power Apps with Power Automate and Microsoft Graph
- Integrating Power Apps and Salesforce
- Creating web-sites with HTML5, CSS3 and Javascript
- Agile software development with Scrum
Additional tools
- AI prompt engineering: Microsoft Copilot, Claude, ChatGPT, DeepSeek, Perplexity
- Coding: Google Analytics, Google Visualization API QL, GitHub, Visual Studio, StackOverflow, QGIS, Anaconda
- Adobe: Analytics (Omniture), Acrobat, Audition, Lightroom, Photoshop, Premiere
- CRM & HR: Salesforce, PeopleSoft, WorkDay, Absence.io
- Project management: Jira, Confluence, Bluejeans, Zoom, Slack, Clearslide, Trello, SurveyMonkey, Miro
Education
Udemy, Microsoft Learn, LinkedIn Learning, W3Schools, edX, DataCamp, TechGig
40+ completed courses on Data normalization, Power BI, Power Apps, Power Automate, SSRS, SSIS, SSAS, R, Shiny, Tableau, Tableau Prep, Google API, Microsoft Fabric, Azure, DAX, HTML5, CSS3, Javascript, SQL, Scrum etc.
2018 - current
University of St. Gallen, Switzerland
MBA in General Management
2006
Moscow State University, Russia
Master of Sciences in Physics
1993
Language skills
- Russian: native
- English: C2
- German: C2
- Italian: A2